Contents
The dashboard says 6x, even 8x. The bank balance says you barely made money. That gap does not mean your ads are broken; it means the number you are watching is not profit.
High ROAS low profit happens because ROAS divides revenue by ad spend and nothing else. Product cost, returns, fees, shipping and overhead never enter the ratio. Compare your ROAS with break-even ROAS (1 ÷ margin). If your ROAS sits below that line, every extra sale deepens the loss.
- ROAS divides conversion value by ad spend; it ignores product cost, returns and operating expenses.
- The metric that matters is net profit. Work backward from your margin: break-even ROAS = 1 ÷ margin.
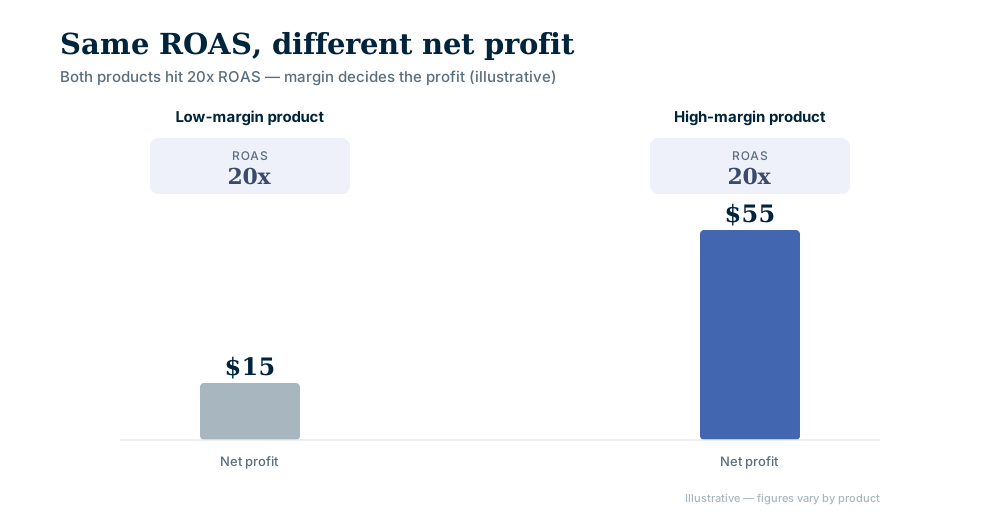
- At the same ROAS, a low-margin product leaves a razor-thin profit while a high-margin one thrives.
- If your site sends gross order values to the tag and refunds are not removed later, ROAS looks better than reality.
- Brand searches and organic sales credited to ads overstate what the ad really did.
High ROAS low profit: why does it happen?
ROAS is conversion value divided by cost. Google's help page defines it that way: a 500% target ROAS means 5 dollars of conversion value for every 1 dollar spent. The conversion value is whatever you report through conversion tracking, so it is a revenue figure you supply, not a profit figure (Google Ads Help: About Target ROAS bidding). Costs only appear in it if you put them there.
Three leaks show up most often.
Product cost and thin margins
A high price does not guarantee a high margin. Example: you sell a 100 dollar product that costs 80 dollars to source. You spend 5 dollars on ads and bring in 100 dollars, so the dashboard shows 20x. Net profit is 100 - 80 - 5 = 15 dollars. The same 20x on a product that costs 40 dollars leaves far more:
| Illustrative comparison | Low-margin product | High-margin product |
|---|---|---|
| Selling price | $100 | $100 |
| Product cost | $80 | $40 |
| Gross profit | $20 | $60 |
| Ad spend | $5 | $5 |
| ROAS | 20x | 20x |
| Net profit | $15 | $55 |
Selling on a marketplace adds commission and shipping to the picture. The Marketplace Profit Calculator puts those lines in one place.
Returns and cancellations
When an order comes back, the revenue goes with it but the ad spend that won the customer does not. Return shipping, repackaging and damaged stock pile on top. If your site sends the gross order value to the conversion tag and refunds are not subtracted later, the ROAS you see is higher than the revenue you kept. Build an estimated return rate into your margin before you set a target.
Common reasons orders come back:
- Product descriptions or photos that set the wrong expectation.
- Quality that does not match the price.
- Size or fit problems.
- Buyer's remorse.
- Wrong item shipped.
Credit given to ads for sales that would have happened anyway
Someone who already knows your brand searches for it, clicks your ad and buys. The ad account records the sale, but that customer might have bought organically. Which click gets the credit depends on the attribution model. In Google Ads, last click gives all credit to the last-clicked ad, while data-driven attribution spreads credit based on your past data and is the default for most conversion actions (Google Ads Help: About attribution models).
| Attribution model | How credit is given | Effect on reported ROAS |
|---|---|---|
| Last click | All credit to the last ad clicked | Can overstate ads on brand-heavy traffic |
| First click | All credit to the first touch | Favors awareness campaigns |
| Linear | Credit split evenly | More balanced, not necessarily true |
| Time decay | More credit to recent touches | Suits short sales cycles |
A longer window can credit more sales to ads, so read the numbers with the window in mind. Our post on the 7-day versus 1-day attribution window shows how much it moves, and why Meta's click metric flatters your ads covers the click side.
What is a good ROAS?
There is no single good number. A good ROAS is one that stays above your own break-even ROAS, and a thinner margin pushes that line higher.
| Contribution margin before ads (illustrative) | Break-even ROAS |
|---|---|
| 20% | 5.0x |
| 25% | 4.0x |
| 40% | 2.5x |
| 50% | 2.0x |
By contribution margin we mean what is left of the selling price after product cost, commission, shipping and the expected cost of returns. The percentages above are examples; plug in your own.
How do you calculate break-even ROAS?
Break-even ROAS is the point where ads pay for themselves: 1 ÷ contribution margin. If you want a profit target, the formula becomes 1 ÷ (contribution margin - target profit share).
- 1Write down the selling price per product.
- 2Subtract product cost, commission, shipping and payment fees.
- 3Subtract the expected cost of returns.
- 4Divide what is left by the selling price to get the contribution margin.
- 5Divide 1 by that margin to get break-even ROAS.
Example: a 40% contribution margin and a 10% target profit share give 1 ÷ (0.40 - 0.10), about 3.3x.
What is POAS?
POAS (profit on ad spend) divides profit instead of revenue by ad spend. Because it includes costs, it shows which campaign actually makes money. If you sell products with very different margins in one campaign, setting a separate target ROAS per product does the same job.
watch profit, let ROAS point the way
A high ROAS is good news, but it does not describe the health of the business on its own. Know your margin, your return rate and your attribution model before you set a target. To see ad spend, product cost and returns in one place, look at AgentFabrica's features, then pick a plan on the pricing page.
Bring content, scheduling and replies into one panel. Start with a free account; scheduling and images come with paid plans.